
| Statistical Analysis on Protein NOESY Distance Restraints |
| Objective: Caluclating statistics on the number of reported NOESY distance restraints per residue for proteins. |
| Method: a) We downloaded the parsed simple NOESY distance database from the NRG (http://restraintsgrid.bmrb.wisc.edu/) database. b) The entries containing nucleic acids were removed. c) 5836 entries (proteins) were used for our statistical analysis. |
| Outputs: a) The list of the PDB entries, reported number of restrains, ratio of #restraints/#residues are tabulated and could be found here (List.csv). b) The histogram of the ratio is shown in Fig. 1. |
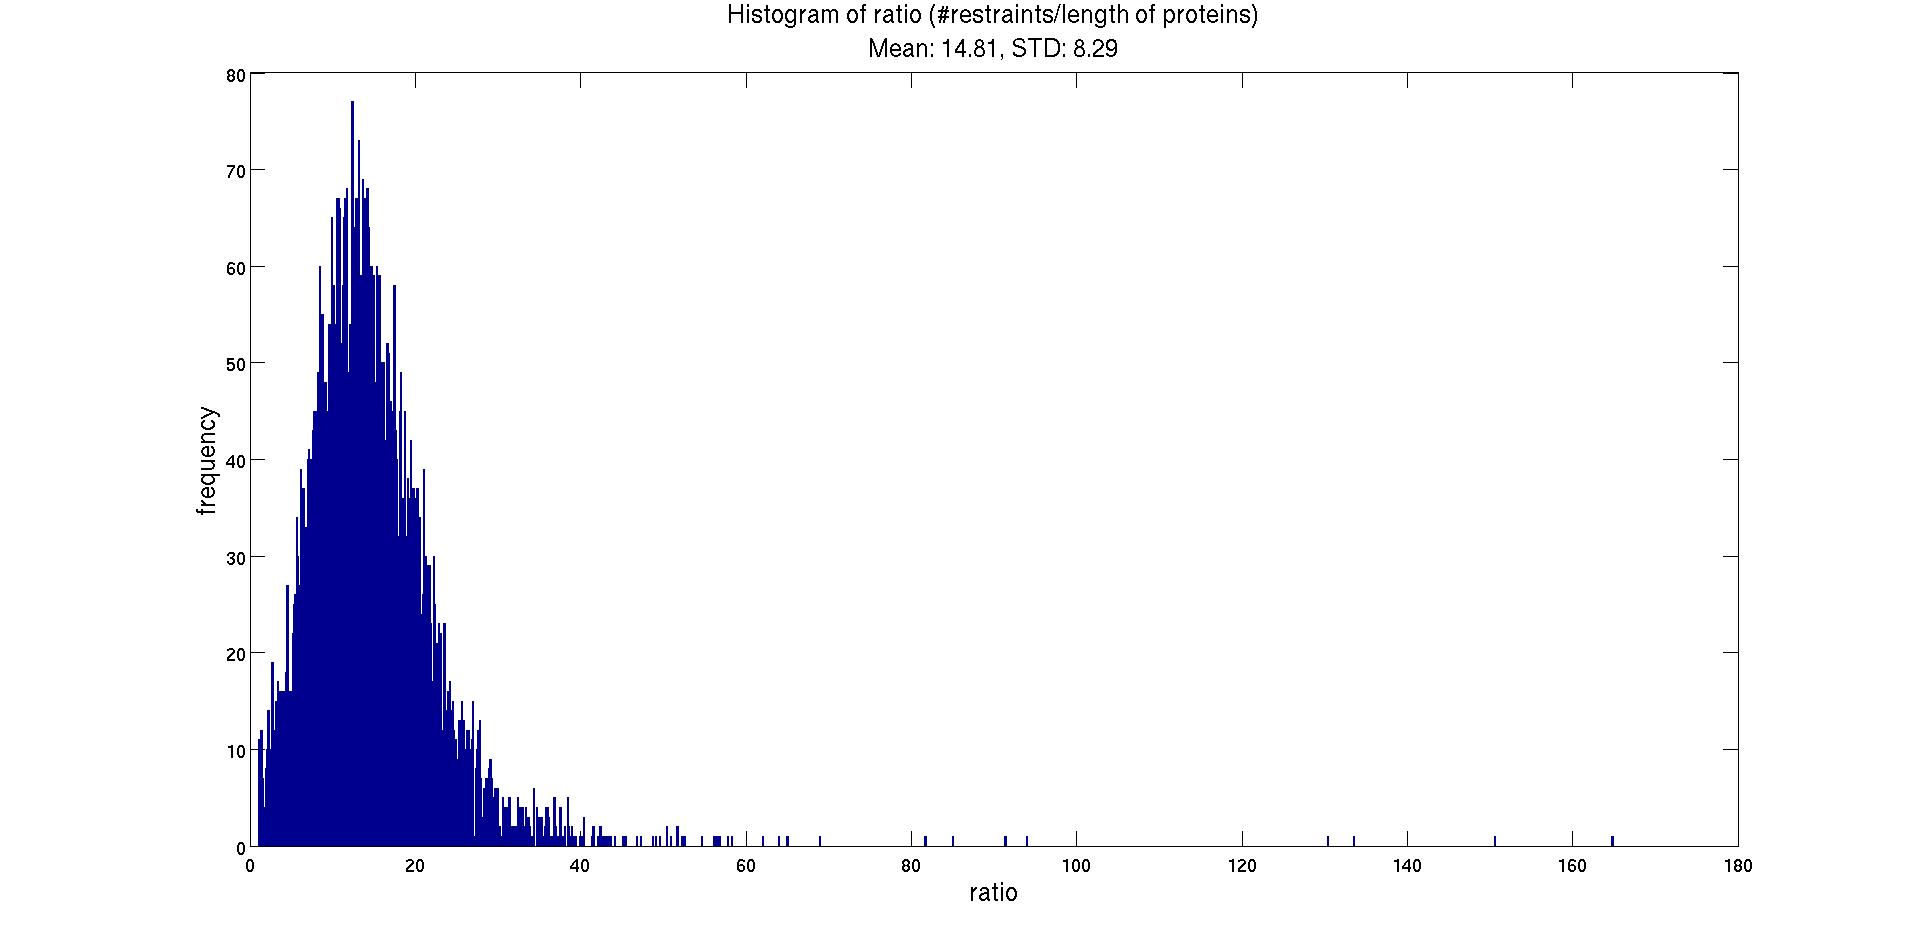
|
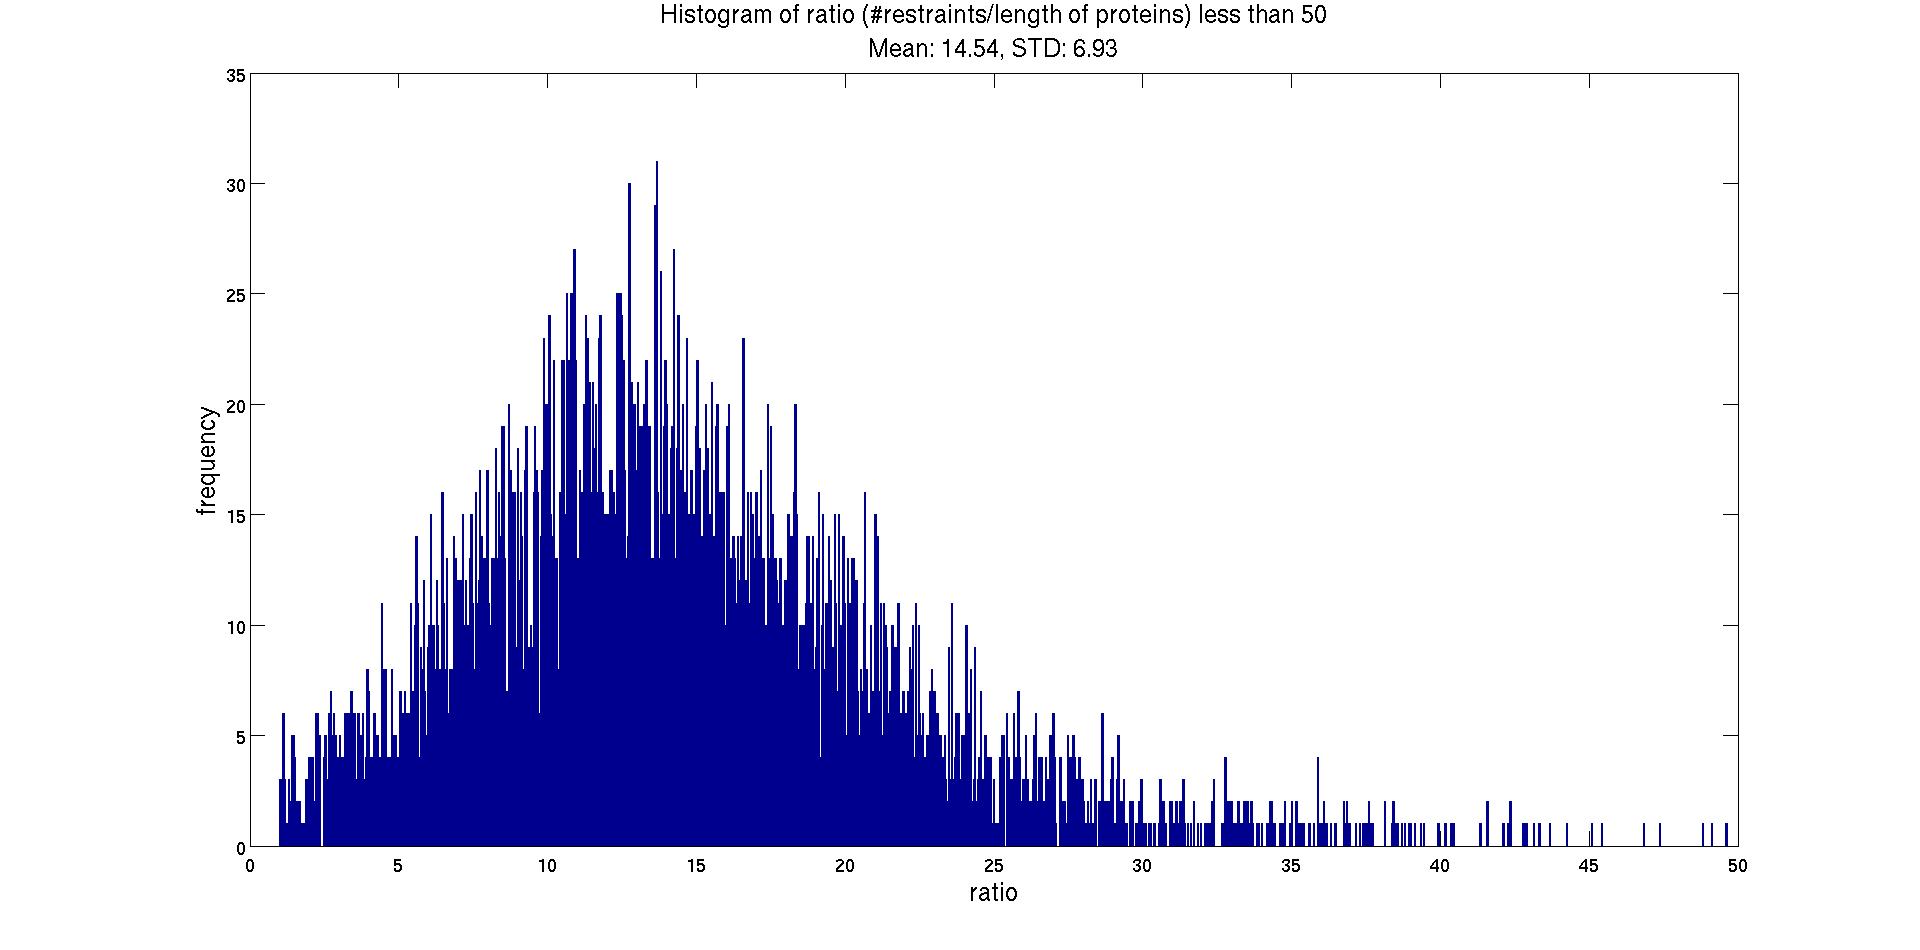
| c) We considered more than 50 restraints per residue as outliers (26 entries) and recalculated the average and std after removing these outliers. Fig. 2 shows the histogram of the remaining 5810 entries. |
|