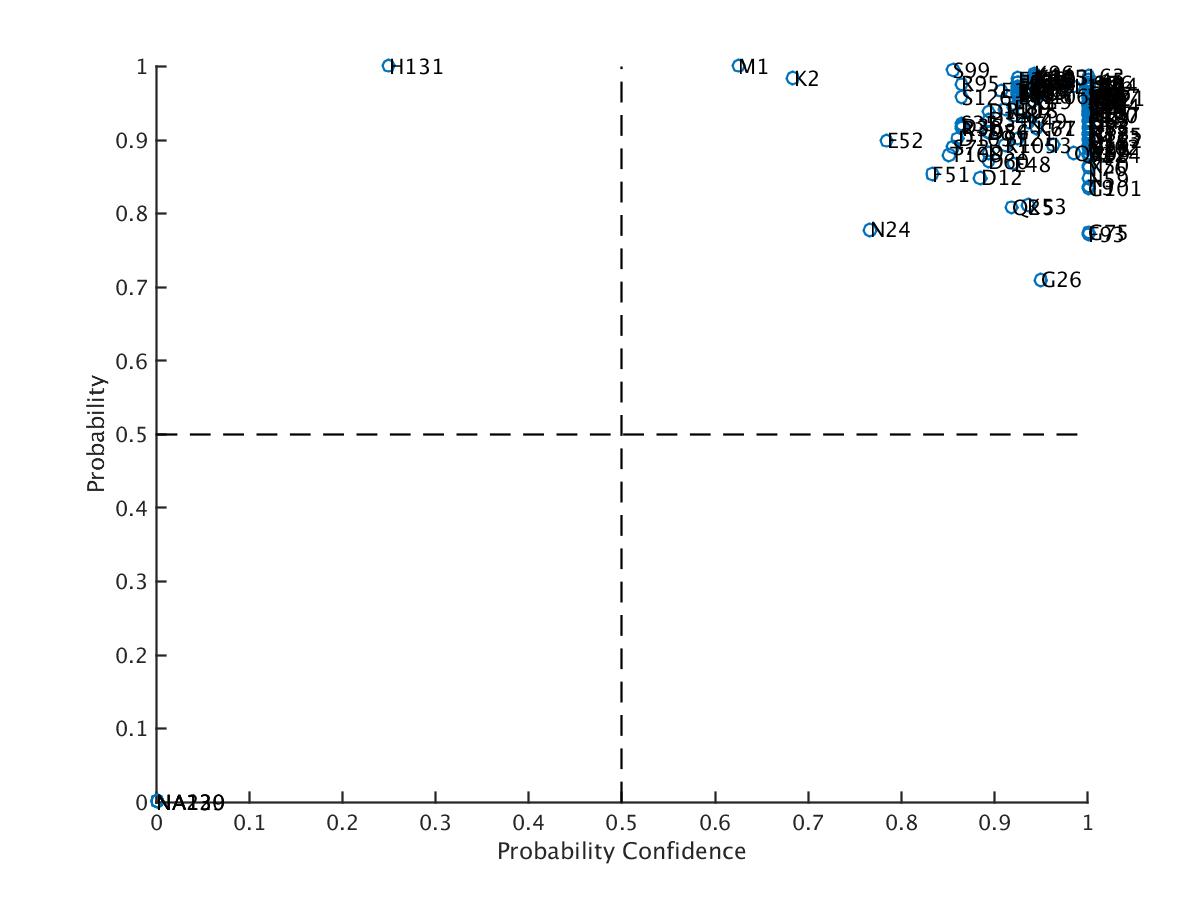
This scatter plot shows residues positions according to their calculated confidence (x-axis) and probability (y-axis).The ideal case is to have the residues on the top-right quadrant (probability > .05 and confidence > .5), while the p-values is less than 0.05.
The details of the outputs can be found in the comprehensive result or ARECA's html output.

